In today’s dynamic work environment, measuring and enhancing employee performance is not just beneficial—it’s essential for the growth and success of organizations. One powerful tool for achieving this is the performance chart. In this comprehensive guide, we will take a look at the significance of a performance chart for employees, explore the steps to create them effectively, and discuss practical ways to utilize these charts to improve your organization’s overall performance.
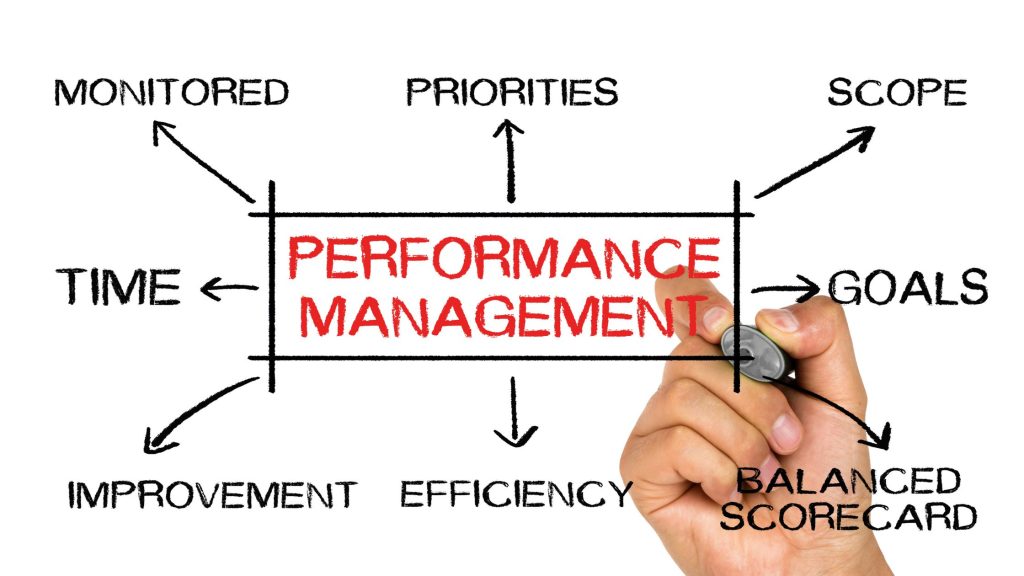
Why Use a Performance Chart for Employees?
Performance charts for employees offer a multitude of benefits:
1. Visual Representation for Clarity
Performance charts provide a clear and visual representation of an employee’s performance over time. They present complex data in an easy-to-understand format, enabling both employees and managers to grasp performance trends, identify areas of improvement, and celebrate successes with a quick glance.
2. Objectivity and Fairness
These charts introduce an objective dimension to performance evaluation. By relying on concrete data and metrics, they reduce biases and subjectivity in performance assessments. This leads to fairer evaluations and greater trust within the organization.
3. Goal Tracking Made Simple
Performance charts allow for the seamless tracking of progress toward individual and team goals. These goals are often specific, measurable, and time-bound (SMART), making it easier to monitor an employee’s journey toward achieving them.
4. Facilitating Constructive Feedback
Constructive feedback is a cornerstone of professional growth. Performance charts serve as a valuable conversation starter during feedback sessions. They provide a visual context for discussing strengths and areas requiring development, promoting open and constructive dialogue.
Steps to Create a Performance Chart for Employees?
To create performance charts that truly make a difference, consider these detailed steps:
Step 1: Define Metrics and Goals
The foundation of any performance chart lies in the metrics you choose to measure and the goals you set. Here’s how to get started:
- Identify Key Metrics: Determine the essential performance metrics that align with an employee’s role and responsibilities. These could include sales targets, project completion rates, customer satisfaction scores, or any other relevant KPIs.
- Set Clear Goals: Establish clear and specific performance goals that are achievable, measurable, and time-bound. Make sure these goals are aligned with the broader objectives of the organization.
Step 2: Gather Comprehensive Data
To create meaningful performance charts, you need accurate and comprehensive data:
- Collect Relevant Data: Gather data that accurately reflects an employee’s performance in the chosen metrics. This might involve data from sales reports, project management tools, customer feedback surveys, or other relevant sources.
- Ensure Data Accuracy: Verify the accuracy of the data you collect. Any inaccuracies can lead to misleading performance assessments.
Step 3: Choose the Right Chart Types
Selecting the appropriate chart types is crucial for effective data visualization:
- Consider Data Types: Choose chart types that best represent your data. For tracking progress over time, line charts are often ideal. Bar charts work well for comparing performance across different categories, while pie charts can illustrate proportions effectively.
Step 4: Design Your Charts
Creating visually appealing and informative charts is essential:
- Select Charting Tools: Use online Excel spreadsheets or specialized data visualization tools to create your charts. These tools often offer a range of design options and customization features.
- Label Clearly: Ensure your charts are well-labeled with titles, axis labels, and legends. Clarity is key to helping viewers understand the data.
Step 5: Regular Updates
Performance charts should be dynamic and regularly updated:
- Maintain Data Freshness: Continuously update your performance charts to reflect ongoing performance. This enables real-time monitoring and adjustments as needed.
Step 6: Provide Feedback and Coaching
Performance charts are not just visual aids; they’re tools for meaningful feedback and growth:
- Feedback Sessions: Schedule regular feedback sessions with employees. Use the charts as visual aids to highlight achievements and areas for improvement.
- Recognize Achievements: Celebrate successes and progress based on the charted data. Recognition can be a powerful motivator.
- Customize Coaching: Analyze the chart data to identify areas where employees may need additional coaching or development. Tailor coaching plans to address specific needs.
By following these steps, you can create performance charts that serve as valuable tools for tracking, evaluating, and enhancing employee performance. These charts not only provide insights but also drive motivation and continuous improvement within your organization.
Utilizing a Performance Chart for Employees Effectively

Once you have created performance charts, it’s essential to harness their potential effectively:
1. Aligning Goals:
- Ensure that employees understand how their performance connects to the broader organizational goals. Use the chart as a visual tool to illustrate this crucial alignment.
2. Motivation and Recognition:
- Use the chart to highlight and celebrate achievements and improvements. Public recognition, whether within the team or organization-wide, can be a powerful motivator.
3. Tailored Coaching and Development:
- Analyze the data on the chart to identify areas where employees may need additional training or support.
- Construct customized coaching and development plans based on the chart’s insights.
4. Integral to Performance Reviews:
- Incorporate performance charts into formal performance review discussions. Encourage employees to provide self-assessments and goals based on the data presented.
5. Benchmarking and Peer Comparison:
- Compare an employee’s performance chart with those of their peers or industry benchmarks. This comparison can reveal high-performing individuals and areas where improvement is needed.
Conclusion
Performance charts for employees are valuable tools for enhancing organizational performance, fostering employee growth, and promoting a culture of continuous improvement. By following the detailed steps outlined in this guide and leveraging performance charts effectively, you can drive productivity, engagement, and success within your organization. These charts are not just visual aids; they are instruments of motivation, growth, and informed decision-making, making them indispensable in today’s workplace.