
Visual representation is the key to understanding data effectively. When it comes to plotting data points, two common choices are scatter plots and line graphs. While they may seem similar at first glance, they serve distinct purposes and convey different types of information. In this comprehensive guide, we’ll take a look at scatter plot vs. line graph, helping you understand when and how to use each for maximum impact.
Scatter Plot: Revealing Relationships
What is a Scatter Plot?
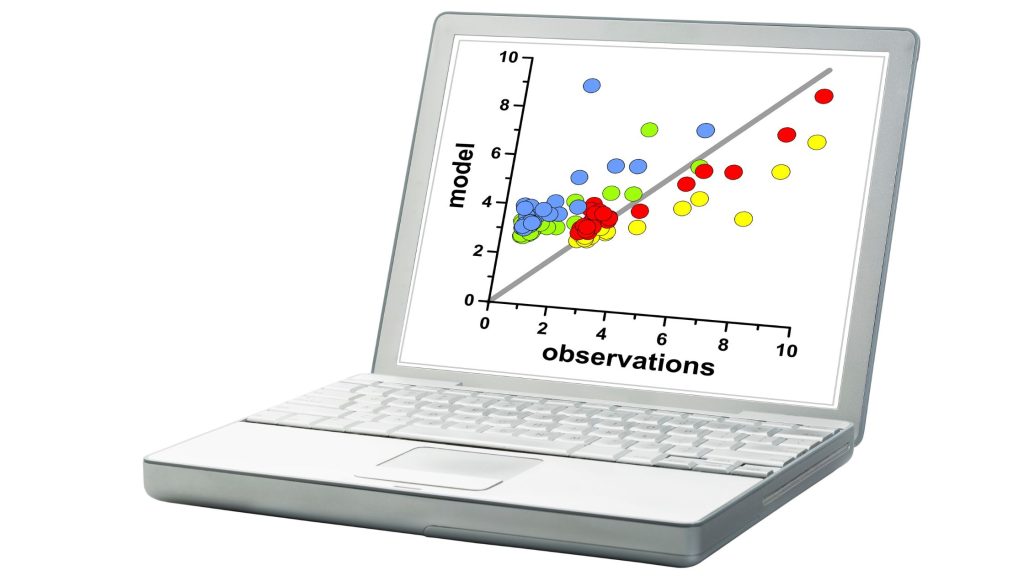
A scatter plot is a graphical representation of individual data points on a two-dimensional plane. Each data point is plotted as a dot, making it an excellent choice for visualizing relationships between two continuous variables.
When to Use a Scatter Plot:
- Showing Relationships: Scatter plots excel at revealing the relationship between two continuous variables. For example, you can use a scatter plot to explore the correlation between study hours and exam scores to determine if more study time leads to better results.
- Identifying Patterns: They are invaluable for identifying patterns or clusters within your data. By visually examining the scatter plot, you can spot trends such as outliers or groups of similar data points.
- Highlighting Discrepancies: When you have data points that deviate significantly from the norm, a scatter plot will make these discrepancies immediately apparent. This can be crucial for outlier detection or quality control.
- Comparing Multiple Groups: Scatter plots offer the flexibility to represent different groups within the same plot. You can use different colors, shapes, or markers to distinguish between groups, allowing for easy comparison of multiple datasets on a single graph.
Scatter Plot Usage Example
Imagine you’re analyzing the relationship between the amount of advertising expenditure and product sales for a range of products. A scatter plot can reveal whether there’s a correlation between the two variables, helping you decide where to allocate your marketing budget for maximum impact.
Line Graph: Tracking Changes Over Time
What is a Line Graph?
A line graph, on the other hand, is designed to display data changes over time or another continuous variable. It connects data points with lines, emphasizing the continuity of the data.

When to Use a Line Graph:
- Showing Trends: Line graphs are your go-to choice when visualizing trends over time or along a continuous scale. Examples include stock price fluctuations over months or website traffic patterns over years.
- Highlighting Continuity: They excel at emphasizing continuity and illustrating how data changes smoothly over time or along a continuous scale. This is particularly useful for data that follows a logical progression.
- Comparing Multiple Series: Line graphs are highly effective when you need to compare multiple data series on a single graph. Each series is represented by a different line, making it easy to see how they relate and whether any patterns emerge.
- Emphasizing Data Flow: Line graphs are excellent at showcasing the flow of data, making it evident how one data point leads to another in a continuous sequence.
Line Grapgh Practical Example
Consider monitoring the monthly website traffic for an e-commerce platform. A line graph can vividly depict how user visits evolve over time. This visualization might reveal seasonal trends, helping the marketing team plan promotions more effectively.
Choosing the Right Graph: A Delicate Balance
Selecting between a scatter plot and a line graph hinges on your data and the message you want to convey. It’s not just about data visualization; it’s about effective communication. Here’s a quick guide to help you decide:
- Use a Scatter Plot when you want to explore relationships between two continuous variables, identify patterns, or highlight discrepancies in your data.
- Use a Line Graph when you’re tracking changes over time or along a continuous scale, showing trends, comparing multiple data series, or emphasizing data flow.
Remember, the effectiveness of your graph also depends on how you format and label it. Ensure your audience can effortlessly understand and interpret the information you present. When it comes to Scatter plot vs. Line graph, you can unlock the full potential of your data and convey your message with clarity and impact by choosing the right graph.


