Webpage Load Time in Chrome with OffiDocs
Ad
DESCRIPTION
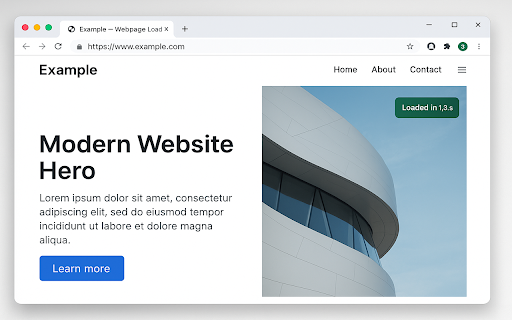
Shows how long the current page took to load.
Page-load performance shapes user satisfaction, search-engine ranking, advertising revenue, and even mobile battery life. Yet gauging it typically means opening DevTools, starting a recording, and interpreting charts—tasks that break flow for developers and are virtually inaccessible to non-technical stakeholders. Webpage Load Time closes that gap. The extension stops a virtual stopwatch the moment the tab finishes loading and shows the result—bold and unmissable—right on the toolbar and, for five seconds, in a small overlay on the page itself. One glance tells you whether a site feels instant or sluggish, no expertise required.
Core features at a glance
Capability
Real navigation timing
Uses the modern Performance Navigation Timing API for millisecond accuracy, with a safe fallback to the classic performance.timing object.
Dual badge display
Shows the figure in both an unobtrusive on-page badge and the extension-button badge so users notice it without hunting.
One keyboard shortcut
Instant feedback loop for developers – Refresh, read the badge, adjust assets, repeat. No need to run Lighthouse for every tiny tweak.
QA-friendly regression checks – Testers can spot a jump from 2.0 s to 3.5 s during sprint demos without opening a single console.
SEO visibility for marketers – Google’s Core Web Vitals penalise slow loads. The extension gives non-devs a tangible metric to track during content updates.
Performance culture across teams – Because the metric appears for everyone, designers, product owners, and executives start discussing speed early—before launch emergencies.
Webpage Load Time web extension integrated with the OffiDocs Chromium online


