Chart Plotter in Chrome with OffiDocs
Ad
DESCRIPTION
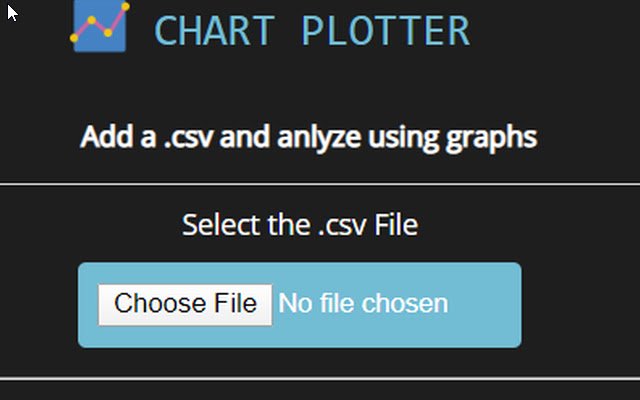
Draw Chart/Graph using .
csv files.
Simply Add a .
csv and anlyze using graphs .
Steps to plot Graph: 1. Add a csv 2. Add the column no for X-axis as per the .
csv 3. Add the column no for Y-axis as per the .
csv 4. Add the row no for the start of the data
Additional Information:
- Offered by shantanujoshi7030
- Average rating : 0 stars (hated it)
Chart Plotter web extension integrated with the OffiDocs Chromium online


