Digital graph in Chrome with OffiDocs
Ad
DESCRIPTION
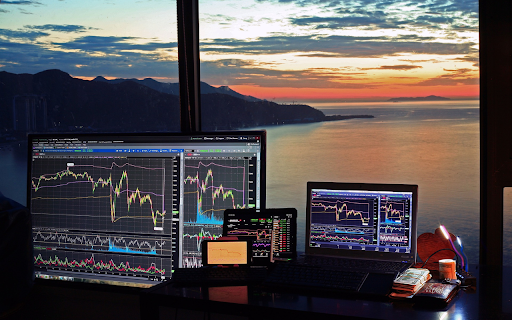
The visual interface is a screen showing market fluctuations with hourly fluctuation charts displayed on computers clearly.
The visual interface is a screen showing market fluctuations with hourly fluctuation charts displayed on computers clearly.
Digital graph web extension integrated with the OffiDocs Chromium online


