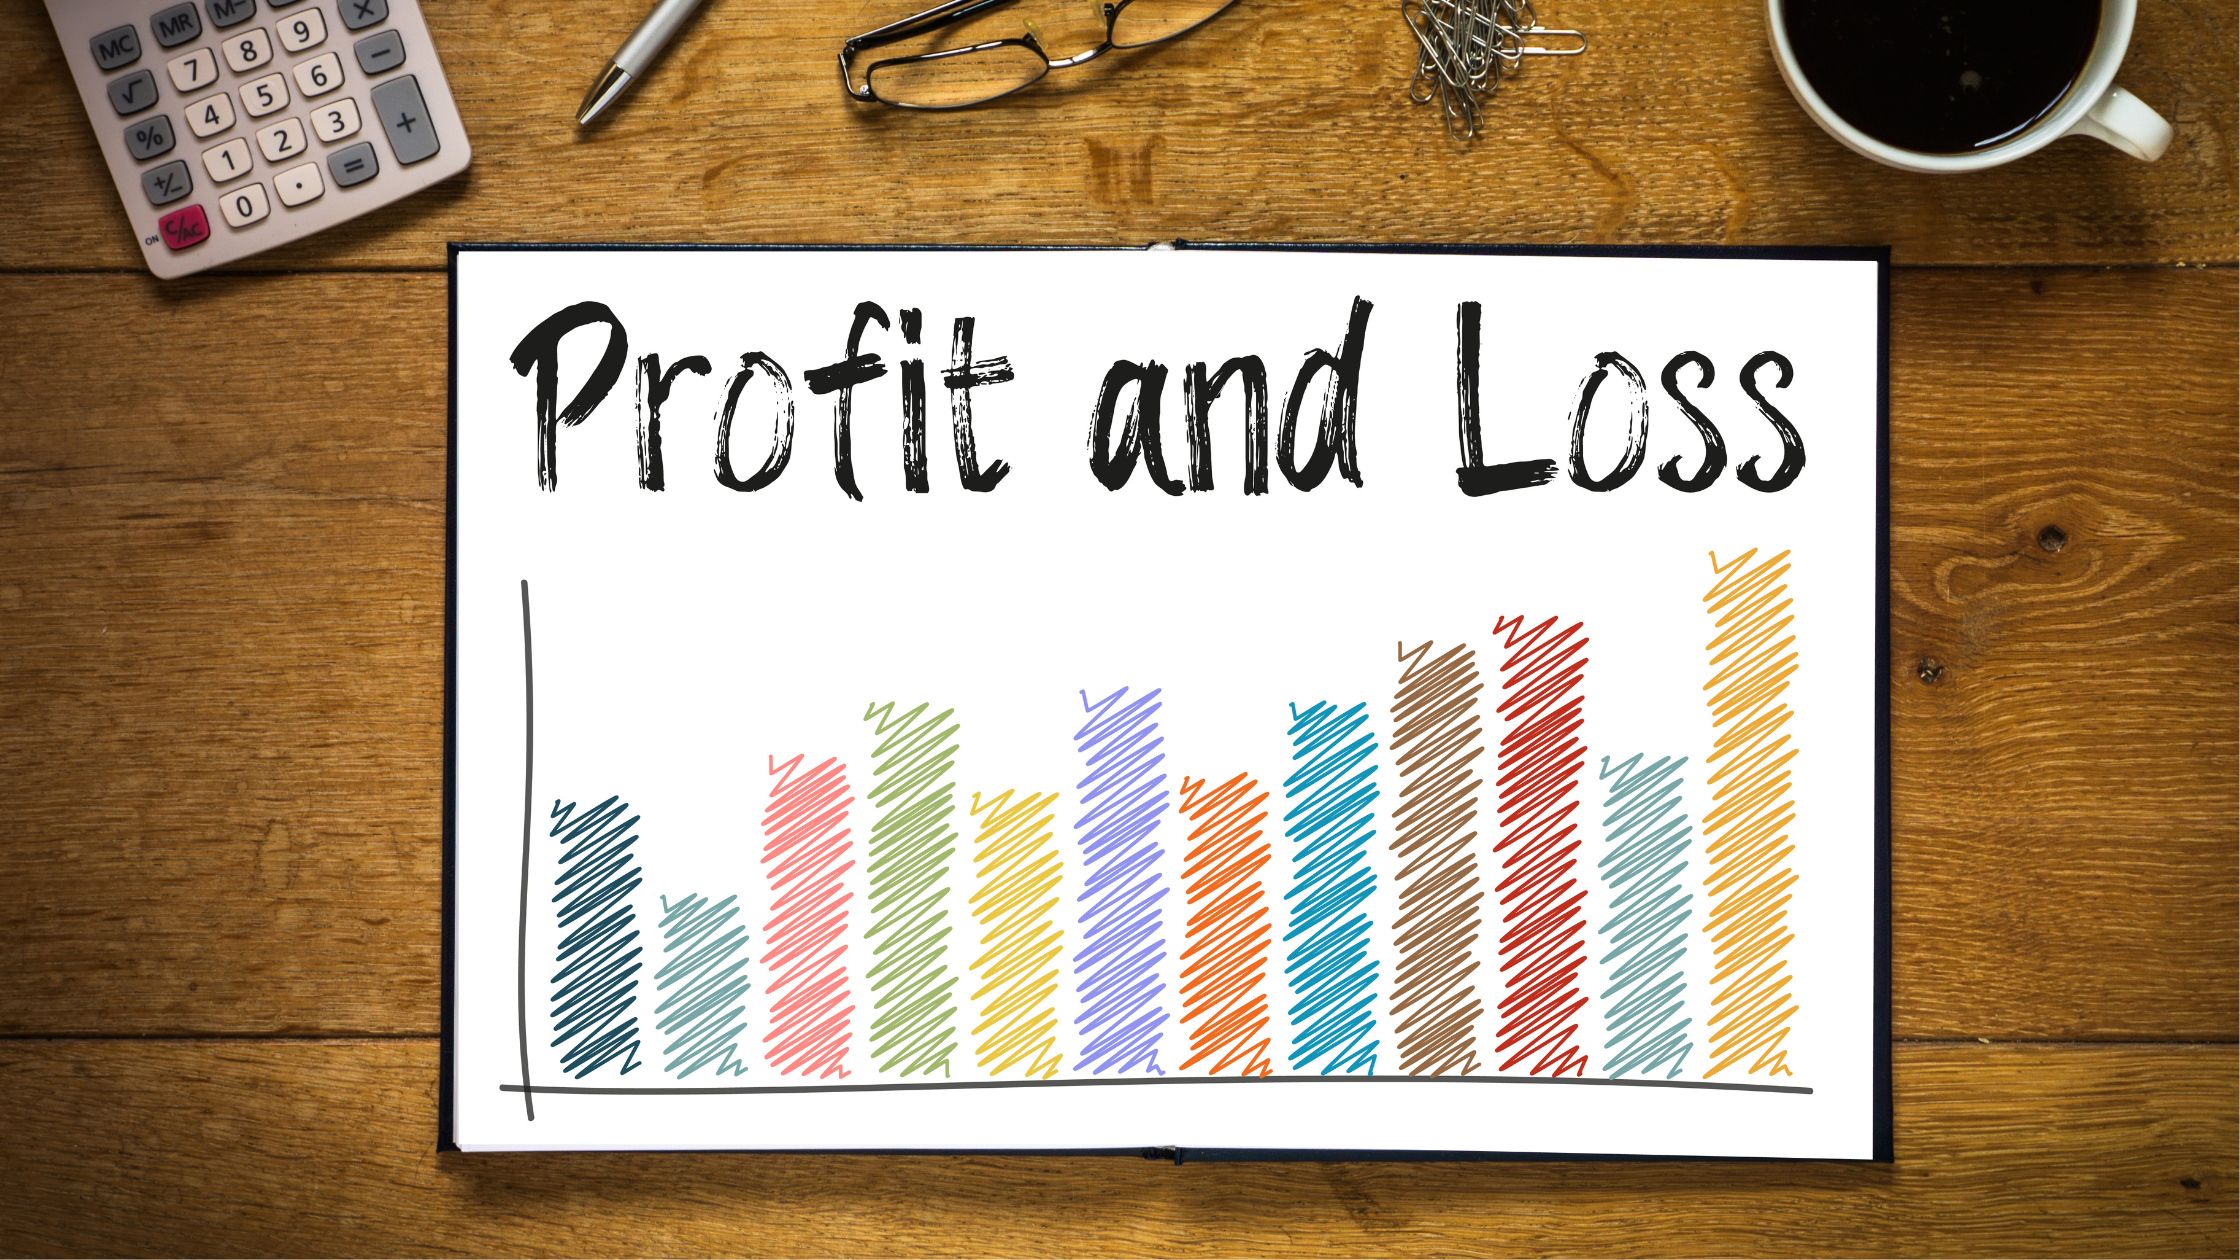
When it comes to analyzing and presenting financial data, the choice of graph plays a crucial role in effectively communicating profit and loss information. Graphs are powerful tools that can help businesses, investors, and analysts gain insights into their financial performance and make informed decisions.
In this article, we will explore different types of graphs and discuss the best options for visualizing profit and loss data. We will also address some frequently asked questions to provide a comprehensive understanding of this topic.
| Quick Answer |
| This article discusses the best graphs for visualizing profit and loss data. The recommended graphs include the Sankey Chart, Matrix Chart, and Treemap Sentiment Chart. By effectively presenting profit and loss information, businesses can gain insights, make informed decisions, and track their financial performance over time. |
What is Profit and Loss (P&L) Statement Analysis?
Definition: A Profit and Loss Statement outlines a company’s revenues, expenses, profits, and losses for a specific time period.
The income vs. expenses graph demonstrates your company’s capacity to generate sales, control expenses, and profit. Accounting principles such as revenue recognition, matching, and accruals can be used to prepare it.
Profit and loss analysis for your company should be done within a specific time frame, such as a month, quarter, or fiscal year. A Profit and Loss (P&L) Statement contains the following main categories:
- Revenue (or Sales)
- Cost of Sales (or Cost of Goods Sold)
- Interest Expense
- Selling, General & Administrative (SG&A) Expenses
- Marketing and Advertising
- Technology/Research & Development
- Taxes
- Net Income
Top Best Graphs to Show Profit and Loss

If you’re looking for the best graphs to show Profit and Loss, then you need one that comes with an ultra-friendly dashboard that will help you access income vs expense graphs, plus lots of other advanced charts missing in Google Sheets. You don’t need any technical skills or knowledge in programming or coding to visualize your profit and loss statement data for in-depth insights.
Here are the 3 best graphs for showing Profit and Loss:
- Sankey Chart
- Matrix Chart
- Treemap Sentiment Chart
Sankey Chart
The Sankey Diagram is one of the best graphs for showing profit and loss. Let’s use the Sankey Chart to visualize the tabular data below.
| Locations | Revenue | Expenses | P&L Analysis | Count |
| North America | Revenue | Loss | Cost of Sales | 132 |
| North America | Revenue | Loss | Cost of General and Administrative | 159 |
| North America | Revenue | Loss | Cost of Marketing | 170 |
| North America | Revenue | Profit | Tax | 182 |
| North America | Revenue | Profit | Profit After Tax | 834 |
| International | Revenue | Loss | Cost of Sales | 162 |
| International | Revenue | Loss | Cost of General and Administrative | 158 |
| International | Revenue | Loss | Cost of Marketing | 145 |
| International | Revenue | Profit | Tax | 171 |
| International | Revenue | Profit | Profit After Tax | 753 |
| Middle East | Revenue | Loss | Cost of Sales | 155 |
| Middle East | Revenue | Loss | Cost of General and Administrative | 166 |
| Middle East | Revenue | Loss | Cost of Marketing | 199 |
| Middle East | Revenue | Profit | Tax | 151 |
| Middle East | Revenue | Profit | Profit After Tax | 685 |
Follow the simple steps below to get started with the best graph to illustrate profit and loss:
- Open the Google Sheets app.
- Open the worksheet and go to the Extensions menu.
- Click the Open button once the Charts, Graphs, and Visualizations by ChartExpo drop-down menu appear.
- Select the Create New Chart option.
- A list of available charts and graphs will appear.
- To access this chart, click the Sankey Chart button.
- As displayed, select the sheet containing your data.
- Provide your metrics and dimensions. We just have one metric in our example, which is the Locations, revenue, expenses, and P&L Analysis are the main variables to fill in.
- Complete the given task (above) by clicking the Create Chart button on the income vs. expense graph maker.
Matrix Chart
A Matrix Chart is a sophisticated graph that you will never see on Google Sheets. Furthermore, it is one of the best graphs for displaying profit and loss. How can a Matrix Chart be used to show your company’s profit and loss statement?
Here’s how;
| Locations | P&L Analysis | Period | Count |
| Florida | Expenses | Current | 2470 |
| Florida | Profit | Current | 109 |
| Florida | Loss | Current | 3 |
| Georgia | Revenue | Current | 2030.9 |
| Georgia | Expenses | Current | 2459 |
| Georgia | Profit | Current | 35 |
| Georgia | Loss | Current | 16 |
| Hawaii | Revenue | Current | 803.1 |
| Hawaii | Expenses | Current | 2256 |
| Hawaii | Profit | Current | 112 |
| Hawaii | Loss | Current | 14 |
| New York | Revenue | Current | 2160 |
| New York | Expenses | Current | 1802 |
| New York | Profit | Current | 87 |
| New York | Loss | Current | 11 |
| Ohio | Revenue | Current | 1469.9 |
| Ohio | Expenses | Current | 750 |
| Ohio | Profit | Current | 56 |
| Ohio | Loss | Current | 30 |
| Alabama | Revenue | Current | 531.1 |
| Alabama | Expenses | Current | 637 |
| Alabama | Profit | Current | 58 |
| Alabama | Loss | Current | 0 |
| California | Revenue | Current | 1559.6 |
| California | Expenses | Current | 627 |
| California | Profit | Current | 38 |
| California | Loss | Current | 10 |
| Colorado | Revenue | Current | 377.6 |
| Colorado | Expenses | Current | 626 |
| Colorado | Profit | Current | 21 |
| Colorado | Loss | Current | 2 |
| Connecticut | Revenue | Current | 488.4 |
| Connecticut | Expenses | Current | 619 |
| Connecticut | Profit | Current | 47 |
| Connecticut | Loss | Current | 20 |
| Delaware | Revenue | Current | 4024.3 |
| Delaware | Expenses | Current | 587 |
| Delaware | Profit | Current | 21 |
| Delaware | Loss | Current | 9 |
Steps
Follow the simple steps below to get started with a Matrix Chart:
- Copy and paste the data table (above) into Google Sheets.
- Open the Google Sheets app.
- Open the worksheet and go to the Extensions menu.
- Click the Open button once the Charts, Graphs, and Visualizations by ChartExpo drop-down menu appear.
- Select the Create New Chart option.
- Choose the sheet containing your data.
- Fill in your dimensions and metrics in the spaces provided. We just have one metric in our example, which is the Period, locations, and P&L Analysis are the main factors to fill in.
- Click the Create Chart button to finish the aforementioned task with the income vs. costs graph maker.
Treemap Sentiment Chart
A Treemap Sentiment Chart is also one of the best graphs for showing profit and loss data for your company. In this section, you’ll learn how to use this chart to visualize your income and expenses data.
Let’s analyze the profit and loss statement (below) of a fictional oil company to determine its financial health.
| Revenue | P&L Analysis | Expenses | Count |
| Revenue | Profit | Operating Profit | 60$ |
| Revenue | Profit | Profit before Tax | 80$ |
| Revenue | Profit | Profit from Sales | 50$ |
| Revenue | Profit | Management Profit | 35$ |
| Revenue | Profit | profit from Development | 20$ |
| Revenue | Loss | Loss from Marketing | 40$ |
| Revenue | Loss | Loss from Sales | 22$ |
| Revenue | Loss | Loss from Exploration | 29$ |
| Revenue | Loss | Loss from Management | 20$ |
| Revenue | Loss | Loss from Development | 15$ |
| Revenue | Expenses | Purchases | 35$ |
| Revenue | Expenses | Royalties and other Taxes | 20$ |
| Revenue | Expenses | Producing and Manufacturing | 80$ |
| Revenue | Expenses | Depreciation | 60$ |
| Revenue | Expenses | Selling | 40$ |
Follow the simple steps below to get started with a Treemap Sentiment Chart:
- Copy and paste the data table (above) into Google Sheets.
- Open the Google Sheets application.
- Open the worksheet and go to the Extensions menu.
- Click the Open button once the Charts, Graphs, and Visualizations by ChartExpo drop-down menu appear.
- Select the Create New Chart option.
- A list of available charts and graphs will appear.
- Fill in the search box with “Treemap Sentiment.”
- Choose the sheet containing your data.
- Fill in the blanks with your metrics and dimension. We only have one metric in our case, and the dimensions variables to fill in are sales, costs, and P&L Analysis.
- Click the Create Chart button to finish the simple data visualization task with the income vs. expense graph maker.
READ ALSO:
- How to Print Gridlines in Excel Online
- How to Import Data into Excel Online
- How to get Excel Certified Online
- How to Access Excel Online
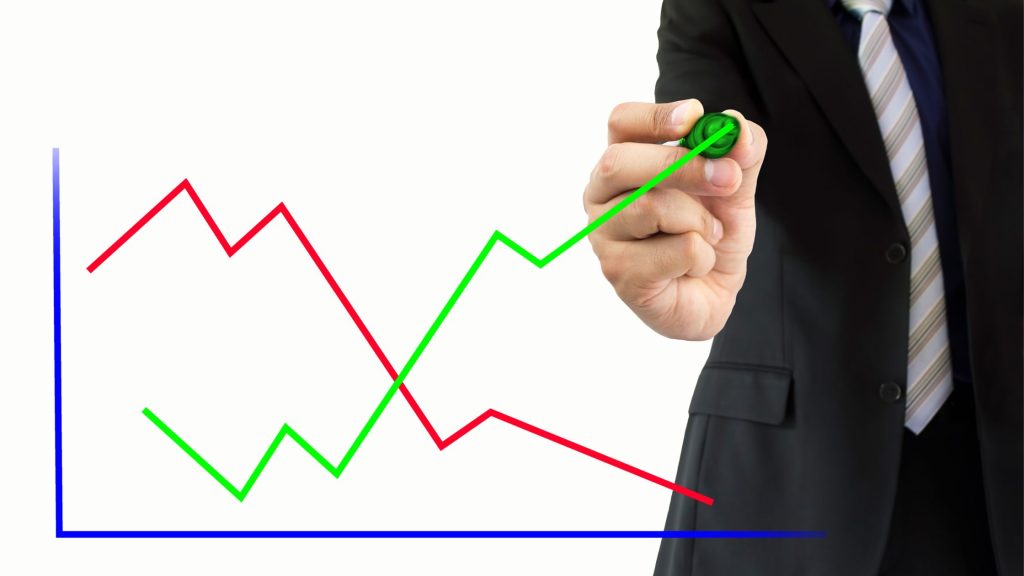
Why is Graph important to Business?

Profit and loss data visualization is critical to growth since it provides in-depth insights into your company’s real-time financial status to all stakeholders (top management, sales, investors, and shareholders). With so much Profit and Loss data available, it’s easy to become overwhelmed or miss out on critical insights.
Having said that, ‘trimming the fat’ from revenue and expense data is crucial to preventing decision-makers from responding to noise or anomalies. This is when graphs like income vs. cost graphs come in handy.
Frequently Asked Questions
The choice of the graph depends on the specific requirements of your analysis and the nature of the data you are working with. Consider factors such as the time period, categories or segments to be compared, and the level of detail required to make an informed decision.
Absolutely! Depending on the complexity of your data and the insights you want to convey, you can use multiple types of graphs together.
For example, you might combine a line graph to show overall trends with a bar graph to compare revenue and expense categories.
Yes, there are several online tools and software available that can assist you in creating various types of graphs to show profit and loss data. Some popular options include Microsoft Excel, Google Sheets, Tableau, and Canva.
The frequency of updating and presenting profit and loss graphs depends on the needs of your business or analysis.
It is recommended to update them regularly, such as monthly, quarterly, or annually, to track changes and make informed decisions in a timely manner.
Yes, most graphing tools allow for the customization of colors, labels, fonts, and other design elements. This allows you to align the appearance of the graphs with your branding or personal preferences.
The Wrap-Up
Visualizing your Profit and Loss Statement should not take long. Furthermore, if you’ve outgrown Google Sheets’ basic charts, try income vs. expenses graph makers, such as the ChartExpo add-on, for a change. It’s easy to use if you carefully follow the steps stated above, you should get your result in no time.


